cate_line_plot(
    estimated_cates,
    *,
    true_cates=None,
    standard_errors=None,
    alpha=0.05,
    window=30,
    figure_kwargs={},
    line_kwargs={},
)
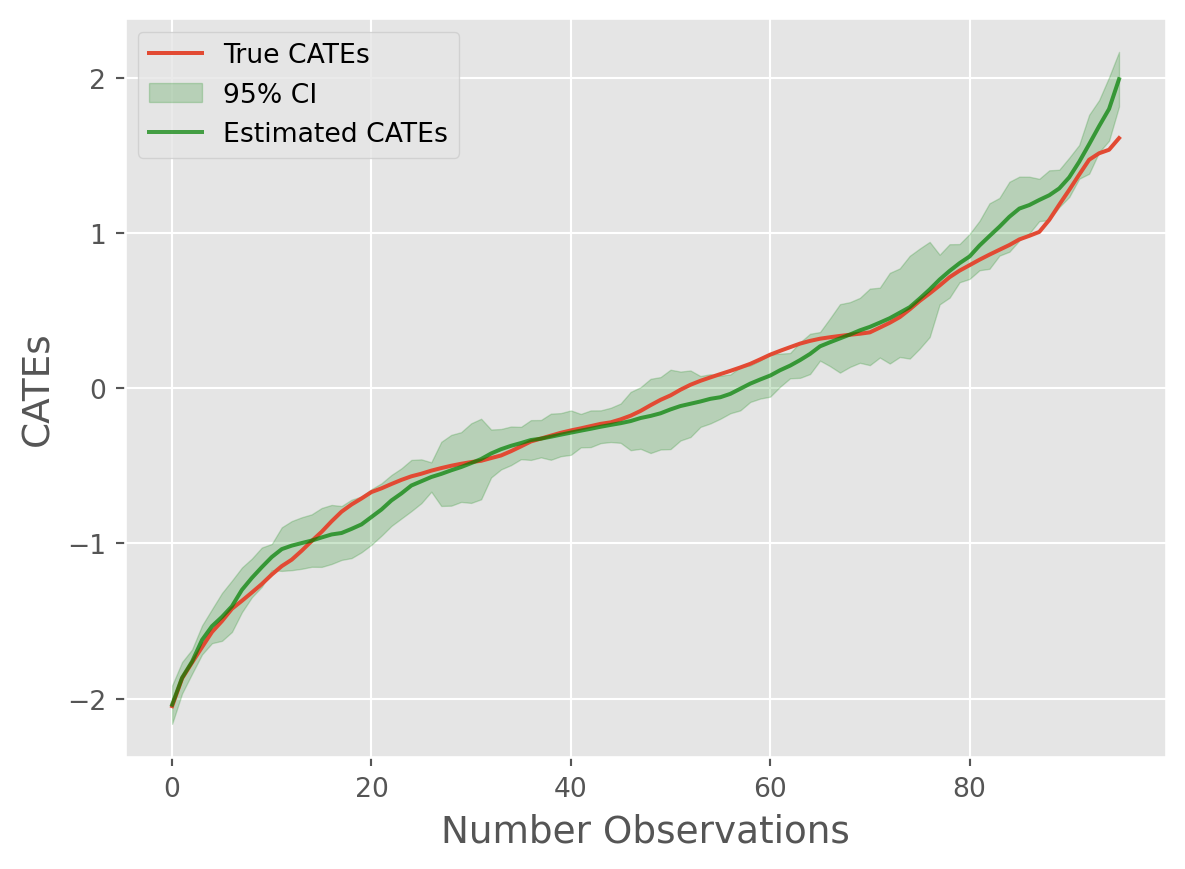
Plots a line plot of the ordered estimated CATEs as a rolling mean with optional confidence intervals.
Parameters
| estimated_cates |
np.ndarray |
The estimated CATEs. |
required |
| true_cates |
np.ndarray | None |
The true CATEs. |
None |
| standard_errors |
np.ndarray | None |
The standard errors of the estimated CATEs. |
None |
| alpha |
float |
The alpha level for the confidence intervals. The default is 0.05, which corresponds to 95% confidence intervals. |
0.05 |
| window |
int |
The window size for the moving average. |
30 |
| figure_kwargs |
dict |
Matplotlib figure arguments. |
{} |
| line_kwargs |
dict |
Matplotlib line arguments. |
{} |
Returns
|
matplotlib.pyplot.Figure |
The line plot figure object. |
Examples
import numpy as np
from caml.extensions.plots import cate_line_plot

np.random.seed(42)
true_cates = np.random.normal(0, 1, 100)
estimated_cates = true_cates + np.random.normal(0, 0.5, 100)
standard_errors = np.abs(np.random.normal(0, 0.1, 100))

fig = cate_line_plot(estimated_cates, true_cates=true_cates, standard_errors=standard_errors, window=5)
fig
Back to top