cate_true_vs_estimated_plot(
    true_cates,
    estimated_cates,
    *,
    figure_kwargs={},
    scatter_kwargs={},
)
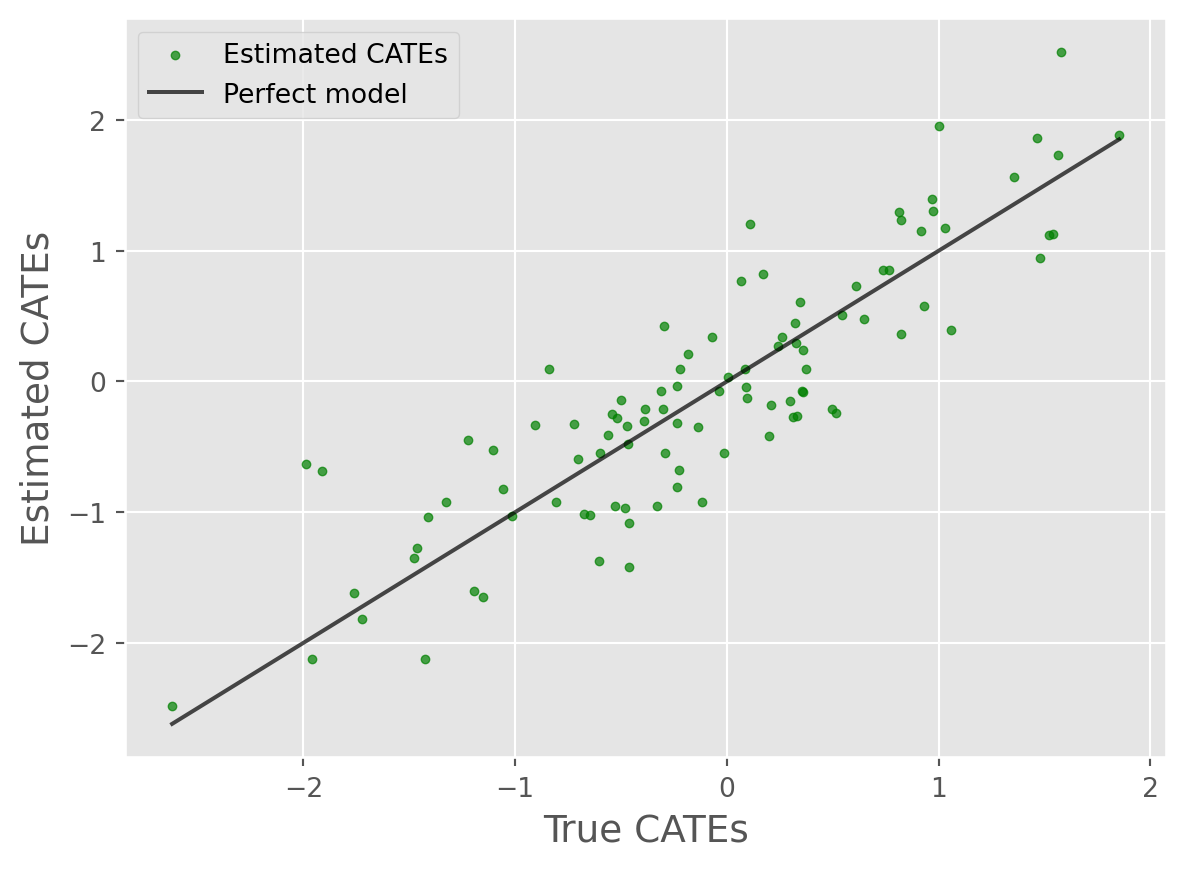
Plots a scatter plot of the estimated CATEs against the true CATEs.
Parameters
| estimated_cates |
ArrayLike |
The estimated CATEs. |
required |
| figure_kwargs |
dict |
Matplotlib figure arguments. |
{} |
| scatter_kwargs |
dict |
Matplotlib scatter arguments. |
{} |
Returns
|
matplotlib.pyplot.Figure |
The scatter plot figure object. |
Examples
import numpy as np
from caml.extensions.plots import cate_true_vs_estimated_plot

np.random.seed(42)
true_cates = np.random.normal(0, 1, 100)
estimated_cates = true_cates + np.random.normal(0, 0.5, 100)

fig = cate_true_vs_estimated_plot(true_cates, estimated_cates)
fig
Back to top